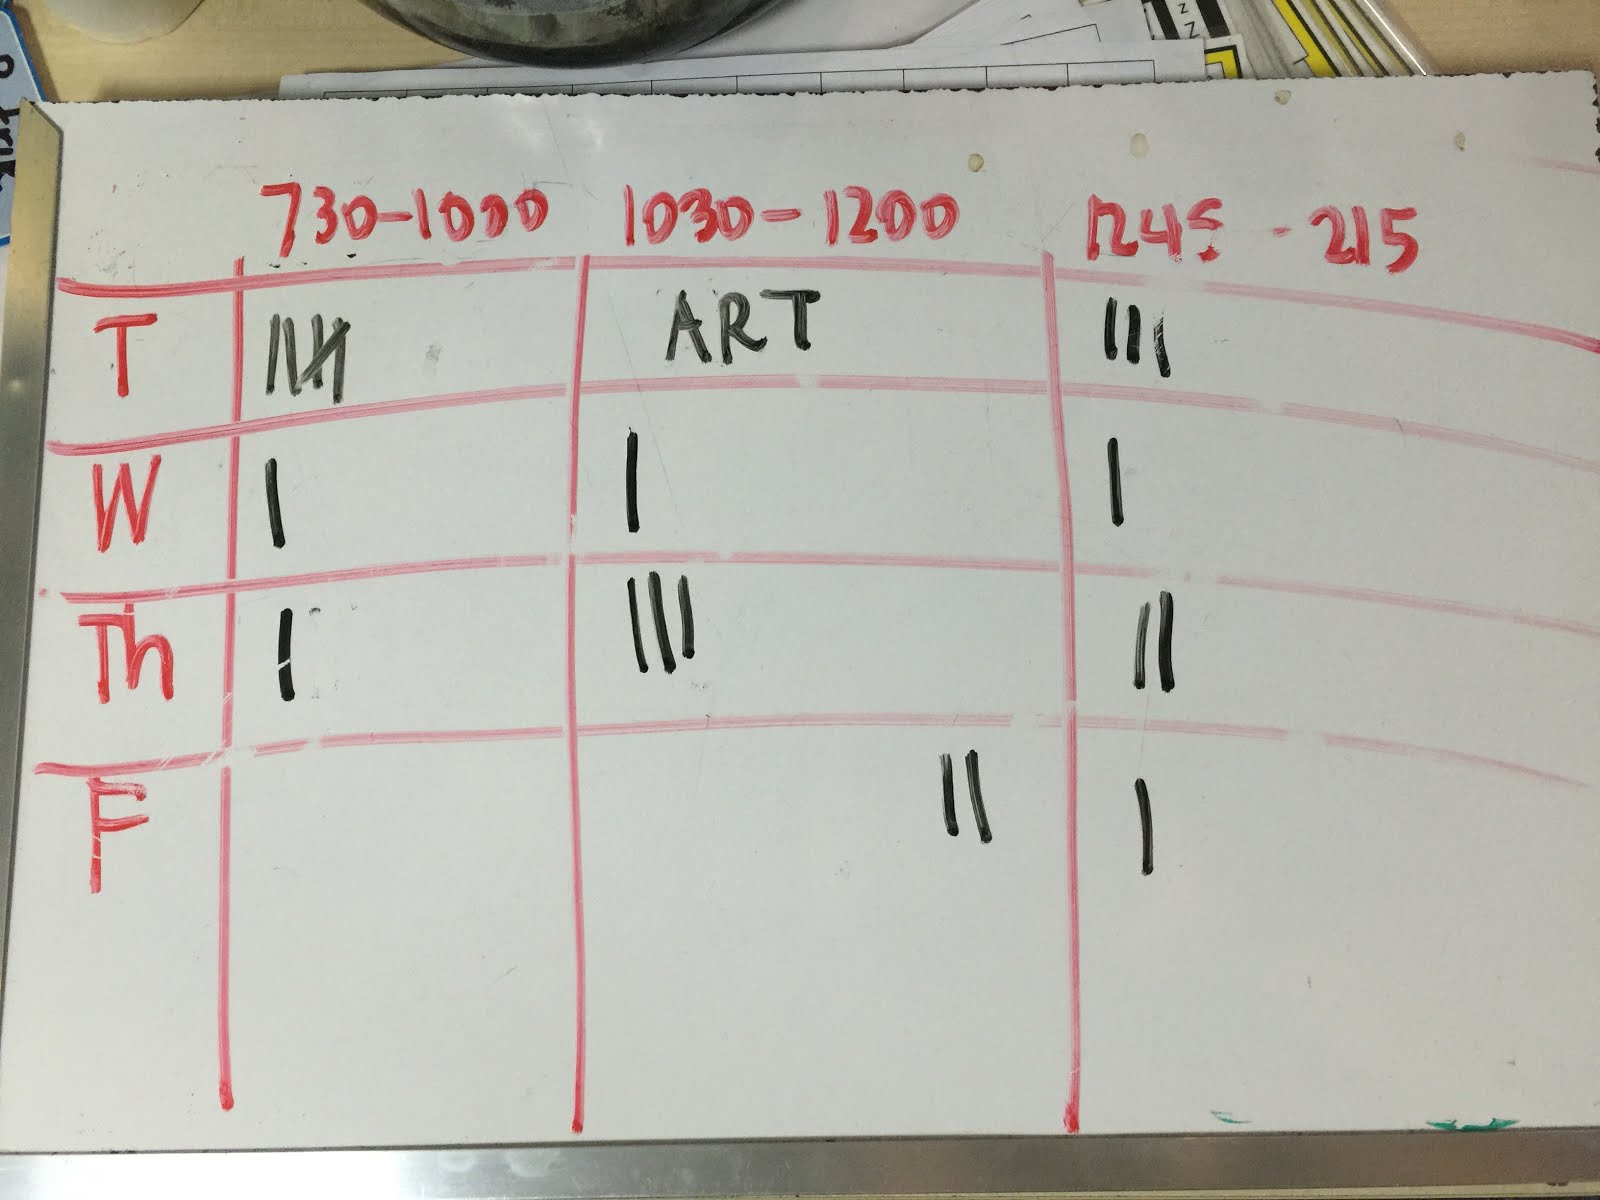
BOPDs have been learning about how to represent and interpret data. There have been numerous instances for us to practice this, for example, sometimes when the class feels too cold and someone want to turn off the airconditioningg, the person first surveys the class and finds out how many people agree to turn it off. In the same manner, Ms Montilla wondered how to find out the frequency of students taking bathroom breaks. She collected data for four days and will soon ask her students to create a bar graph to show the data and to help the class make decisions.
Showing posts with label graphs. Show all posts
Relevant Data
BOPDs have been learning about how to represent and interpret data. There have been numerous instances for us to practice this, for example, sometimes when the class feels too cold and someone want to turn off the airconditioningg, the person first surveys the class and finds out how many people agree to turn it off. In the same manner, Ms Montilla wondered how to find out the frequency of students taking bathroom breaks. She collected data for four days and will soon ask her students to create a bar graph to show the data and to help the class make decisions.
Graphs and collaboration
BOPDs integrated literacy with Mathematics when they plotted their goals on a graph. The graph reflects the choices that students made to become better readers. It also tells us where our strengths lie as a class and how we can collaborate to for further understanding.
Subscribe to:
Posts (Atom)